

S&P Global (SPGI)
S&P Global (SPGI)
Not only a credit ratings company but much more

Company Description
S&P Global is the leading provider of ratings, benchmarks, analytics and data to the capital and commodity markets worldwide. The company is headquartered in Manhattan (New York City) and has a market capitalization of $108Bn with annual revenues (after IHS Markit) of around $12Bn. We will talk later about the acquisition of IHS Markit, but after that, the company will now have 6 reporting segments (% of revenue between parentheses):
Ratings (33%): You may know the company because of this division. S&P is a leading credit rating, research and analytics provider to market participants. Credit ratings are one of the several tools investors can use when making decisions on fixed income investments. They’re basically a grade and an opinion for the credit worthiness of the issuer or a particular issue based on both its capacity and willingness to service debt. In other words, it’s a measure of the credit quality of debt and its associated likelihood that the issue may default.
Market Intelligence (31%): It’s a portfolio of capabilities that help investment professionals, governments, corporations and academia make better decisions and research. An example of a well-known product of the company is the S&P Capital IQ.
Commodity Insights (13%): Formerly known as “Platts”. It’s the leading independent provider of information and benchmark prices for the commodity and energy markets. This service enables the commodity and energy markets to perform with greater transparency and efficiency. Key clients for this segment are producers, traders and intermediaries within the energy, petrochemicals, metals and agriculture markets.
Mobility (10%): Here they provide data and insight for the mobility sector. For example, one of the most trusted and iconic brands in their portfolio is Carfax which provide individuals and business with vehicle data like “CARFAX Vehicle History Report” or car valuations. They help car dealers, car makers, auto suppliers, banks, insurers and customers make better informed decisions. For example, they help dealers (58% segment revenues) and manufacturers (25%) price vehicles more effectively.
Indices (10%): S&P is a global index provider maintaining a wide variety of indices to meet an array of investor needs. Indices (like the S&P500) are tools that help investors track the performance of markets. Indices derive revenue form asset-linked fees when investors direct funds into its proprietary designed or owned indexes, sales-usage royalties of its indices, and to a lesser extent data subscription arrangements.
Engineering Solutions (3%): They provide to engineers, architects and other technical professionals with technical expertise. Example: Their tools help ensure design compliance and construction methods with current regulations.
Company History
In 1860, Henry Varnum Poor published “History of the Railroads and Canals of the US” which was the first attempt to arm investors with data on the growing US railroad industry. In 1868, after being appointed by the US government as a commissioner for the Union Pacific Railroad and gaining valuable insights, publishes “Manual of the Railroads of the US”. That publication was a guide that helped readers make informed decisions by allowing them to monitor railroad performance.
Simultaneously, in 1884, Charles Dow invents the first stock index which contained 11 railroad stocks. A few years later, Charles Dow creates the Dow Jones Industrial Average, providing information with unprecedented speed. Few years later, in 1906 Luther Lee Blake founds the Standard Statistics Bureau to provide current information on non-railroad industrials. Standard Statistics delivers index cards, each containing current news items, to investors to complement the publication.
The origins of the S&P’s commodities business, formerly known as “Platts”, traces back to 1909 when reporter Warren C. Platt published the National Petroleum News, introducing competition to the markets and helping establish Platts as a leader in global energy, chemical and commodities information.
Poor’s Publishing issues its first credit rating in 1916, providing subscribers forward-looking, standardized data on issuers’ creditworthiness. Standard Statistics follows suit in 1922.
Of course, the services of Standard Statistics and Poor’s Publishing were very similar and it made sense to merge the companies. So, in 1941, both companies merged bringing to life the company we know now as Standard & Poor’s. The new organization leveraged increased capabilities in credit ratings, business information and indices to serve customers across the globe. Following the merger, in 1957, S&P creates the world’s most tracked index, the S&P 500 Index. It was the first index that was computer-generated. And this is an example of how S&P works. They strive to apply advances in technology to stay at the forefront of the industry. Short after that, in 1966, S&P joins McGraw-Hill, growing S&P’s scale and capabilities as a global purveyor of financial information. In decades to come, the ratings offering is nationally recognized by the SEC as a statistical rating organization.
From approximately the start of the new millennium, McGraw-Hill, which included holdings in Educational Materials, TV stations, among other businesses, started selling those. In February 2016, McGraw-Hill finally announced that it would rename his financial business as S&P Global by the end of April 2016.
Indeed, we can’t omit the 2008 financial crisis period. The rating franchise (then inside McGraw-Hill) took a hit after the crisis from controversy over assigning top grades to complex securities backed by subprime mortgages that blew up when the US housing bubble popped. S&P paid $1.5Bn, without admitting wrongdoing, to resolve litigation with the Justice Department, states and others stemming from its ratings of mortgage bonds. So, you may be thinking how big is this business nowadays for S&P… It’s a $458m business out of $8.3Bn total revenues. So, 5.5%. Not as big as just before the financial crisis in 2007.
Take a look at this chart:
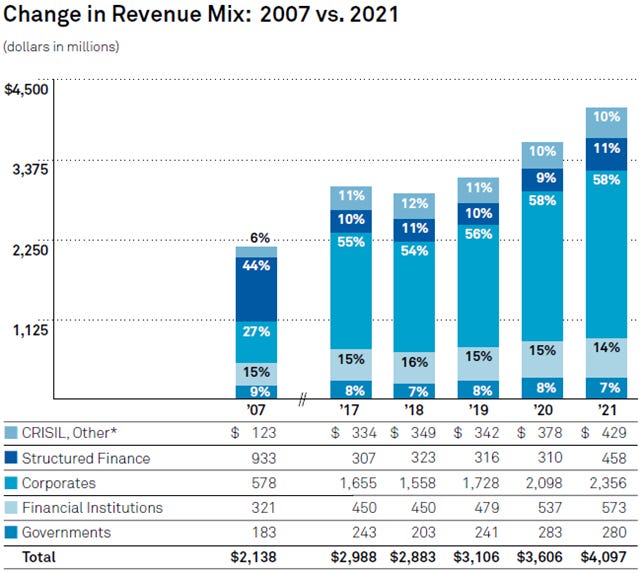
Source: S&P Global. 2021 Investor Fact Book.
Here are a couple of examples of how innovative the culture of S&P has been through the years. Back in 1999, McGraw-Hill and RobecoSAM launched the Dow Jones Sustainability Index (well before ESG was as well-know as it is nowadays). Furthermore, in 2019, S&P Ratings was born and approved as the first international credit ratings agency to enter the domestic China bond market. So, from 2016 to today, the company has been acquiring businesses to stay at the forefront of information technology. They acquired Kensho (company with leading AI and Machine Learning capabilities) or Panjiva (that helps clients increase global supply chain efficiency).
Regarding the IHS Markit transaction in 2022, S&P agreed to buy it for about $44Bn in an all-stock deal with a relatively small premium of less than 5%. After the transaction, S&P Global shareholders retained 68% of the combined entity and IHS Markit shareholders received 0.2838 shares of S&P Global for each IHS share. As per Fitch, S&P have paid an EV/EBITDA of 24,1x ex-synergies, nearly double what the London Stock Exchange (LSE) paid for Refinitiv (EV/EBITDA of 13,4x). I understand that IHS deserves a higher multiple because of its higher quality business assets, but time will tell if the price was too much.
IHS Markit was formed in 2016 by the merger of two small players, IHS and Markit. They track millions of data points in financial markets. The company owns software that big Wall Street banks use to underwrite corporate stock and bond offerings, and tracks transportation and energy data, the latter of which could pair with S&P’s Platts. Products of IHS Markit are as important as products from S&P for investment professionals. For example, IHS is the owner of iTraxx/CDX indices that track Investment Grade and High Yield Spreads. These indices are a very important tool for participants in the fixed income markets.
After the transaction: the business mix of S&P will have a higher portion of recurring revenues (75,7% vs current 69,3% standalone) and will look like as follows:

Source: S&P Global. 2021 Investor Fact Book.
Competitive Dynamics and Economics
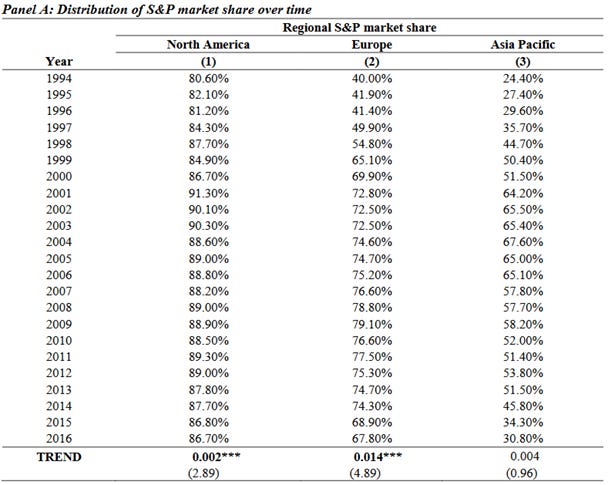
Ratings business: I might say this is the business with an enormous moat around it. The credit rating business is an oligopoly split between the “Big 3” rating agencies: S&P Global, Moody’s and Fitch Ratings being S&P the most prominent between the three with an estimated aggregate global market share of >90%.

Source: Market Power and Credit Rating Standards: Global Evidence. MIT Sloan, 2019.
Businesses and governments pay to S&P to rate their bonds because by doing so, they increase their access to capital and they lower their cost of capital. So, while the cost of rating a bond is very cheap (some bps on the notional), the tightening in the cost of capital is much higher. Thus, it makes economic sense to pay for that service. This happens because, most of the capital (funds, pension plans…) is only allowed to invest in rated bonds. So, an issuer with no credit rating will only have access to a VERY limited pool of capital.
Illustrative example:

So, as you now know, the key to achieve lower interest rates is to have access to the greatest amount of capital. This explains why S&P has the highest market share: brand name, trust and network effects. S&P is the preferred Credit Rating Agency by all market participants. S&P has been in this business for so many years, and their credit scores have proven to be reliable and valuable over time for both the investor (risk management and transparency) and the issuer (lower interest rates). Thus, every market participant prefers to use S&P before Moody’s, and Moody’s before Fitch. Otherwise, neither the investors nor the issuers will attain their objectives.
Furthermore, it makes sense to rate a bond by more than one rating agency! Although the cost/benefit will depend on the issuer, sometimes having more than one rating pays off. Why? Again, access to a higher pool of capital. There are some mandates that are only allowed to invest in bonds with at least 2 bond ratings. So, rating a bond by two rating agencies increases the pool of capital of that bond to those mandates.
Unfortunately, this business is cyclical to some extent. Around 42% of revenues of the Ratings division is transactional led. Thus, with central banks tightening and interest rates sky-rocketing, next year revenues will decrease with respect to the 2021 figure because of lower liability management activity by issuers.
Nonetheless, the company forecasts 6%-9% organic growth rate until 2026 with an operating margin in the range of 58-60%. They want to achieve this by extending their expertise across new risk types, markets, and technologies. Also, their unique position in key strategic markets like China or India may prove to be a key driver to future growth.
Key competitors: Moody’s and Fitch Ratings.

Market Intelligence: Next year, this segment will overcome the Ratings division. The company estimates a $70Bn TAM (Total Addressable Market) in this segment after the acquisition of IHS (note that 50% of the revenues now come from IHS). As per the company, the segment is poised to growth organic revenue at 7-9% per year and EBIT margin of 35-37% by 2026.
This segment is highly recurrent and is mostly based on a subscription model (98% of revenues as of FY21). Furthermore, this is a channel from which the company can cross-sell other products like ratings and leverage the analytics generated in other parts of the business. With the advances in AI, Machine Learning, Computation and the increase in passive investment strategies, the financial information industry has experienced a lot of interest recently. Some relevant deals in the industry recently:
January 2021: London Stock Exchange completes de acquisition of Refinitiv.
August 2021: Moody’s acquires RMS (climate and natural risk modelling and analytics) for $2Bn. In 2021, the company was expected to generate $320m in revenue and $55m adj. EBIT. By 2025 they expect to generate $150m.
November 2021: Alphabet invests $1Bn in CME Group to move the company’s core trading system to the cloud.
December 2022: Microsoft acquires 4% of London Stock Exchange as part of a 10y strategic partnership to take LSE assets to the cloud and jointly develop products.
Although this business is highly recurrent, the competitive positioning of S&P is not as good as in the ratings segment (though not an irrelevant player). We can differentiate 2 segments by their nature:
Research, data and Analytics (c.75%): S&P’s flagship product is Capital IQ which is a desktop research platform. Key competitors in this business are Bloomberg, Factset and Refinitiv Eikon.
Enterprise solutions (c.25%): These are workflow solutions focused on the loan market so market participants can efficiently trade, manage and settle operations. Key competitors in this business are LSEG and other exchanges.
The top financial analytics, research and data service companies in the world is by far Bloomberg. For so many years, Bloomberg has been the most used platform for both businesses. The reason to that is because (i) it takes time to learn and become proficient in their platform (aka Cost of Change) and (ii) it has a Chat from which you can trade (aka Network Effects). Here are some literal quotations from de European Commission study on the LSEG-Refinitiv transaction (case M.9564):
Raiffeisen Bank: “the reason for the majority of our staff using Bloomberg (BB) Desktop instead of other desktop solutions is the Bloomberg Chat - this feature is not available as a stand-alone application but it's the most spread chat application in the financial industry especially for non- or semi-automated trading and brokerage”
BNP Paribas: “importance of Bloomberg’s chat community is a strong element for decision”
Money.net: “Bloomberg has a proprietary chat system. It’s almost monopolistic. A lot of Wall Street uses it. In a lot of banks, you’ll have two people using Bloombergs and they don’t look at anything but the chat. They’re paying $25,000 a year to be on chat.”
This is the reason why Bloomberg’s business has been so powerful (and so expensive) all these years. Nonetheless, after the transactions mentioned above, LSEG may become the first candidate to challenge this monopoly. After the deal with Microsoft, integrating Teams (or something similar) into Refinitiv Eikon doesn’t seem too difficult.
Ok, going back to S&P’s competitive positioning. As per data from the European Commission, they estimate the market share for fundamental data in the EEA as follows (mkt share ranges): Bloomberg (30-40%), S&P (10-20%), and Factset (10-20%) with Refinitiv below those levels. Then, as you can see the current competitive positioning of S&P is quite solid, but it’s worth remembering that it might lose some ground after the Microsoft-LSEG deal (but not as much as Bloomberg).
This segment is too broad and here I’m only trying to provide you with a glimpse of the competitive positioning. There are other opportunities in this segment beyond capital IQ and workflow. As an example, insurance companies (e.g., better risk assessment) or private equity companies (e.g., industry fundamentals) as well as traditional corporates (e.g., supply chain) are also eager for market intelligence around their businesses. The key element to be understood here is the fact that market intelligence reduces informational friction and hence companies like S&P can offer a Win-Win deal to their clients.
Commodity Insights (formerly Platts): The company estimates a $10.6Bn TAM (Total Addressable Market) in this segment after the acquisition of IHS (note that 40% of the revenues now come from IHS). Thus, their estimated market share in this business is 17%. As per the company, the segment is poised to growth organic revenue at 7-9% per year with an estimated EBIT margin of 48-50% by 2026. This business is also highly recurrent as its 90% subscription based.
The competitive advantage here is strong. S&P’s products are deeply embedded in user workflows and their data is global and high-quality. Also, here they expect to generate $100m revenue synergies and $70m cost synergies with the IHS transaction.
Global Mobility: This business is 100% from IHS Markit. Here they provide data and insight for the mobility sector. The value proposition here is quite the same as the previous two segments: reduce informational friction. A key aspect of this segment is that it’s present in all stages of the vehicle lifecycle. From the strategy and product planning of OEMs and auto parts suppliers (e.g.: how many vehicles do I need to build with what content?) to the used vehicle sales (e.g.: how should I price my used car?).
They expect to achieve 7-9% annual organic revenue growth and 41-43% operating profit margin by 2026.
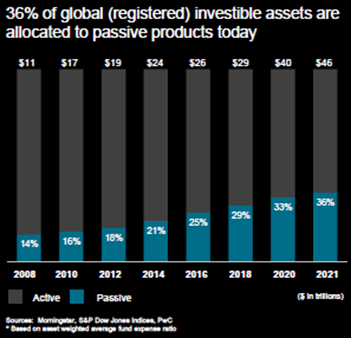
Indices: This business is also wonderful. A part from having an operating margin around 70%, they expect to achieve >10% annual organic revenue growth by 2026 thanks to the increasingly relevant role of passive investment.

Source: S&P Global. Investor Day 2022 presentation.
Indices generates revenue from the following sources:
Investment vehicles — asset-linked fees such as exchange traded funds (“ETFs”) and mutual funds, that are based on the S&P Dow Jones Indices' benchmarks that generate revenue through fees based on assets and underlying funds;
Exchange traded derivatives — generate sales usage-based royalties based on trading volumes of derivatives contracts listed on various exchanges;
Index-related licensing fees — fixed or variable annual and per-issue asset-linked fees for over-the-counter derivatives and retail-structured products; and
Data and customized index subscription fees — fees from supporting index fund management, portfolio analytics and research
S&P has various of the most equity tracked indices in the markets (S&P 500, Dow, VIX…) and, after the transaction with IHS (which accounts for only c. 8% of revenue), they are also very relevant in the Fixed Income & CDS indices business (e.g.; iBoxx, CDX & iTraxx).
Here, the key competitive advantage is brand although there is some Network Effect too. As per the European Commission investigation on LSEG-Refinitiv (case. M.9564), Citigroup said: “[o]ur requirements are mostly dictated by [our] clients, hence indices are not interchangeable. If a client requires an index from Vendor A, we need to acquire Vendor A’s index, though other providers may cover the same geography.”. In the same document, the EC tests whether clients will switch from vendor if they increase prices by 5-10%. Only 26% of respondents would change.
Key competitors in equity indices are MSCI, FTSE Russell (LSEG) and Bloomberg. Key competitors in fixed income are Bloomberg-Barclays and Intercontinental Exchange.
Key figures:
The company financials are enviable. The company’s EPS CAGR growth over the last 6 years has been 9.5% boosted by a 7.9% sales CAGR growth and 5pp adj. EBIT margin expansion. ROIC has been stable over the last 6y which demonstrates the company’s ability to do bolt-on M&A. ROIC without goodwill has been deteriorating although it makes sense since (i) the baseline ROIC is excellent and (ii) the new investments’ ROICs are around 30%, that is: it creates a lot of value!
As the business is very Cash Flow generative and capex-light, the company is able to distribute most of the Free Cash Flow via both dividends and repurchases (target remuneration of at least 85%). The rest of money is employed on bolt-on acquisitions and capex.
From a credit perspective, the company enjoyed a very healthy profile with low leverage and high ICRs. This is even true after the IHS transaction (ND/EBITDA 2.6x as of 3Q22). They look now to maintain a structure of 2.0-2.5x ND/EBITDA.
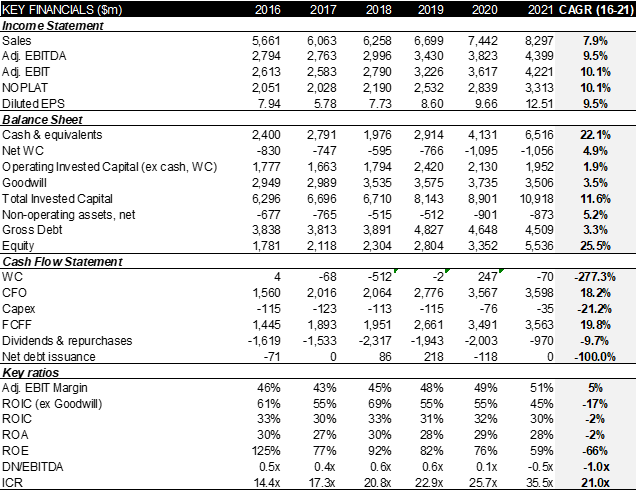
Source: Company data
Governance and Incentives
Management Team:
CEO: Douglas L. Peterson, member of the BoD and CEO since 2013. Before joining the company in 2011, he was COO of Citibank (Citigroup principal banking entity). MBA from Wharton.
CFO: Ewout Steenbergen was appointed CFO in 2016. Previously, he was CFO of Voya Financial (insurance) where he strengthened its balance sheet, de-risked its investment portfolio and executed a robust IPO in 2013. He holds a master’s degree in Actuarial Science from the University of Amsterdam.
Compensation of top executives:
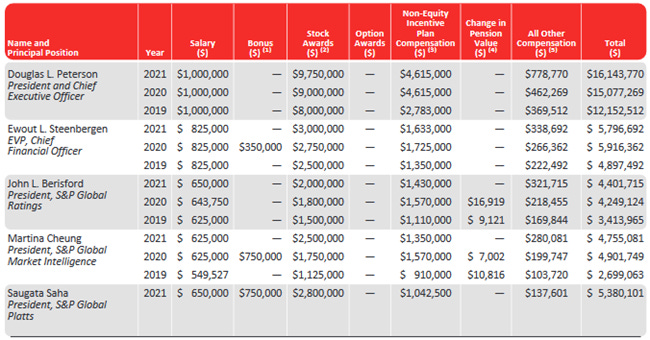
Source: Company data. Proxy Statement 2022.
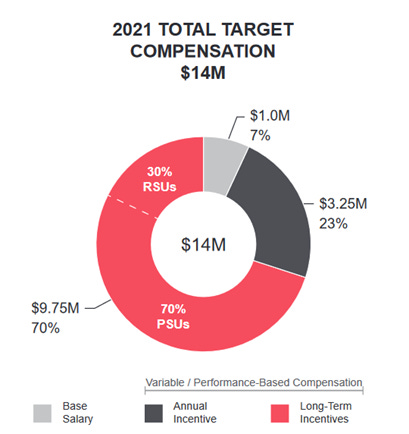
CEO compensation: Total CEO compensation in 2021 was $14m represented 0.5% of total attributable net income which is fair. The structure of incentives is also fair with most of remuneration being based on long-term incentives. However, the structure in my opinion is a little bit biased towards growth. I would like to see a more holistic structure with items like leverage and ROICs. Details below:
Source: Company data. Proxy Statement 2022.
Base salary is fair.
Short-term annual incentives are 100% cash and based on 30% individual performance and 70% company business goals (Revenue growth and EBITA margin expansion as well as business-building metrics of customer, operations and people). Target levels:
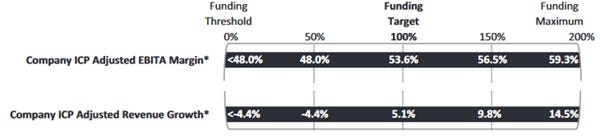
Source: Company data. Proxy Statement 2022.
Long-term incentives (LTI) are 100% equity based with a 3y vesting period (subject to clawback). LIT can be broken down to 30% RSUs (which are not dependent on performance – which is not fair) and 70% PSUs which are performance-based. The PSUs are based on EPS growth (this explains partly repurchases). Target levels:

Source: Company data. Proxy Statement 2022.
Valuation
S&P multiple has increased considerably during the last decade. Nonetheless, we should put into perspective the multiple during the period 2011-2015. Back then, the company was part of McGraw Hill Financial and included other businesses that were not as attractive as the ones that have now S&P. Thus, after the sale of those businesses, the company deserved a higher multiple
